Sti index and etf
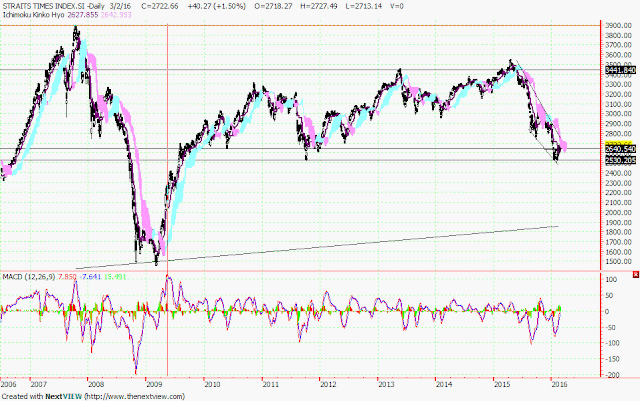
Sti index have done a small rectangle or sideway than come up. its now in his down slop resistant.
As seem from the chart above, In the big picture, it might be a long term side way. Esp if he break the down slow of mid term trend.
Sti etf chart track similar to Sti index. Of cause it does.
But do be careful of the support line, if break will show a bad fall.
As seem from the chart above, In the big picture, it might be a long term side way. Esp if he break the down slow of mid term trend.
Sti etf chart track similar to Sti index. Of cause it does.
But do be careful of the support line, if break will show a bad fall.


Comments
Post a Comment